BTC.D Chart Proves Bitcoin Failed: Should Be Over 66% To Avoid Inevitable Permanent Contraction, Currently 58% Shows Earth Cluster Refused To Keep Feeding The Beast
The Chart That Proves Everything
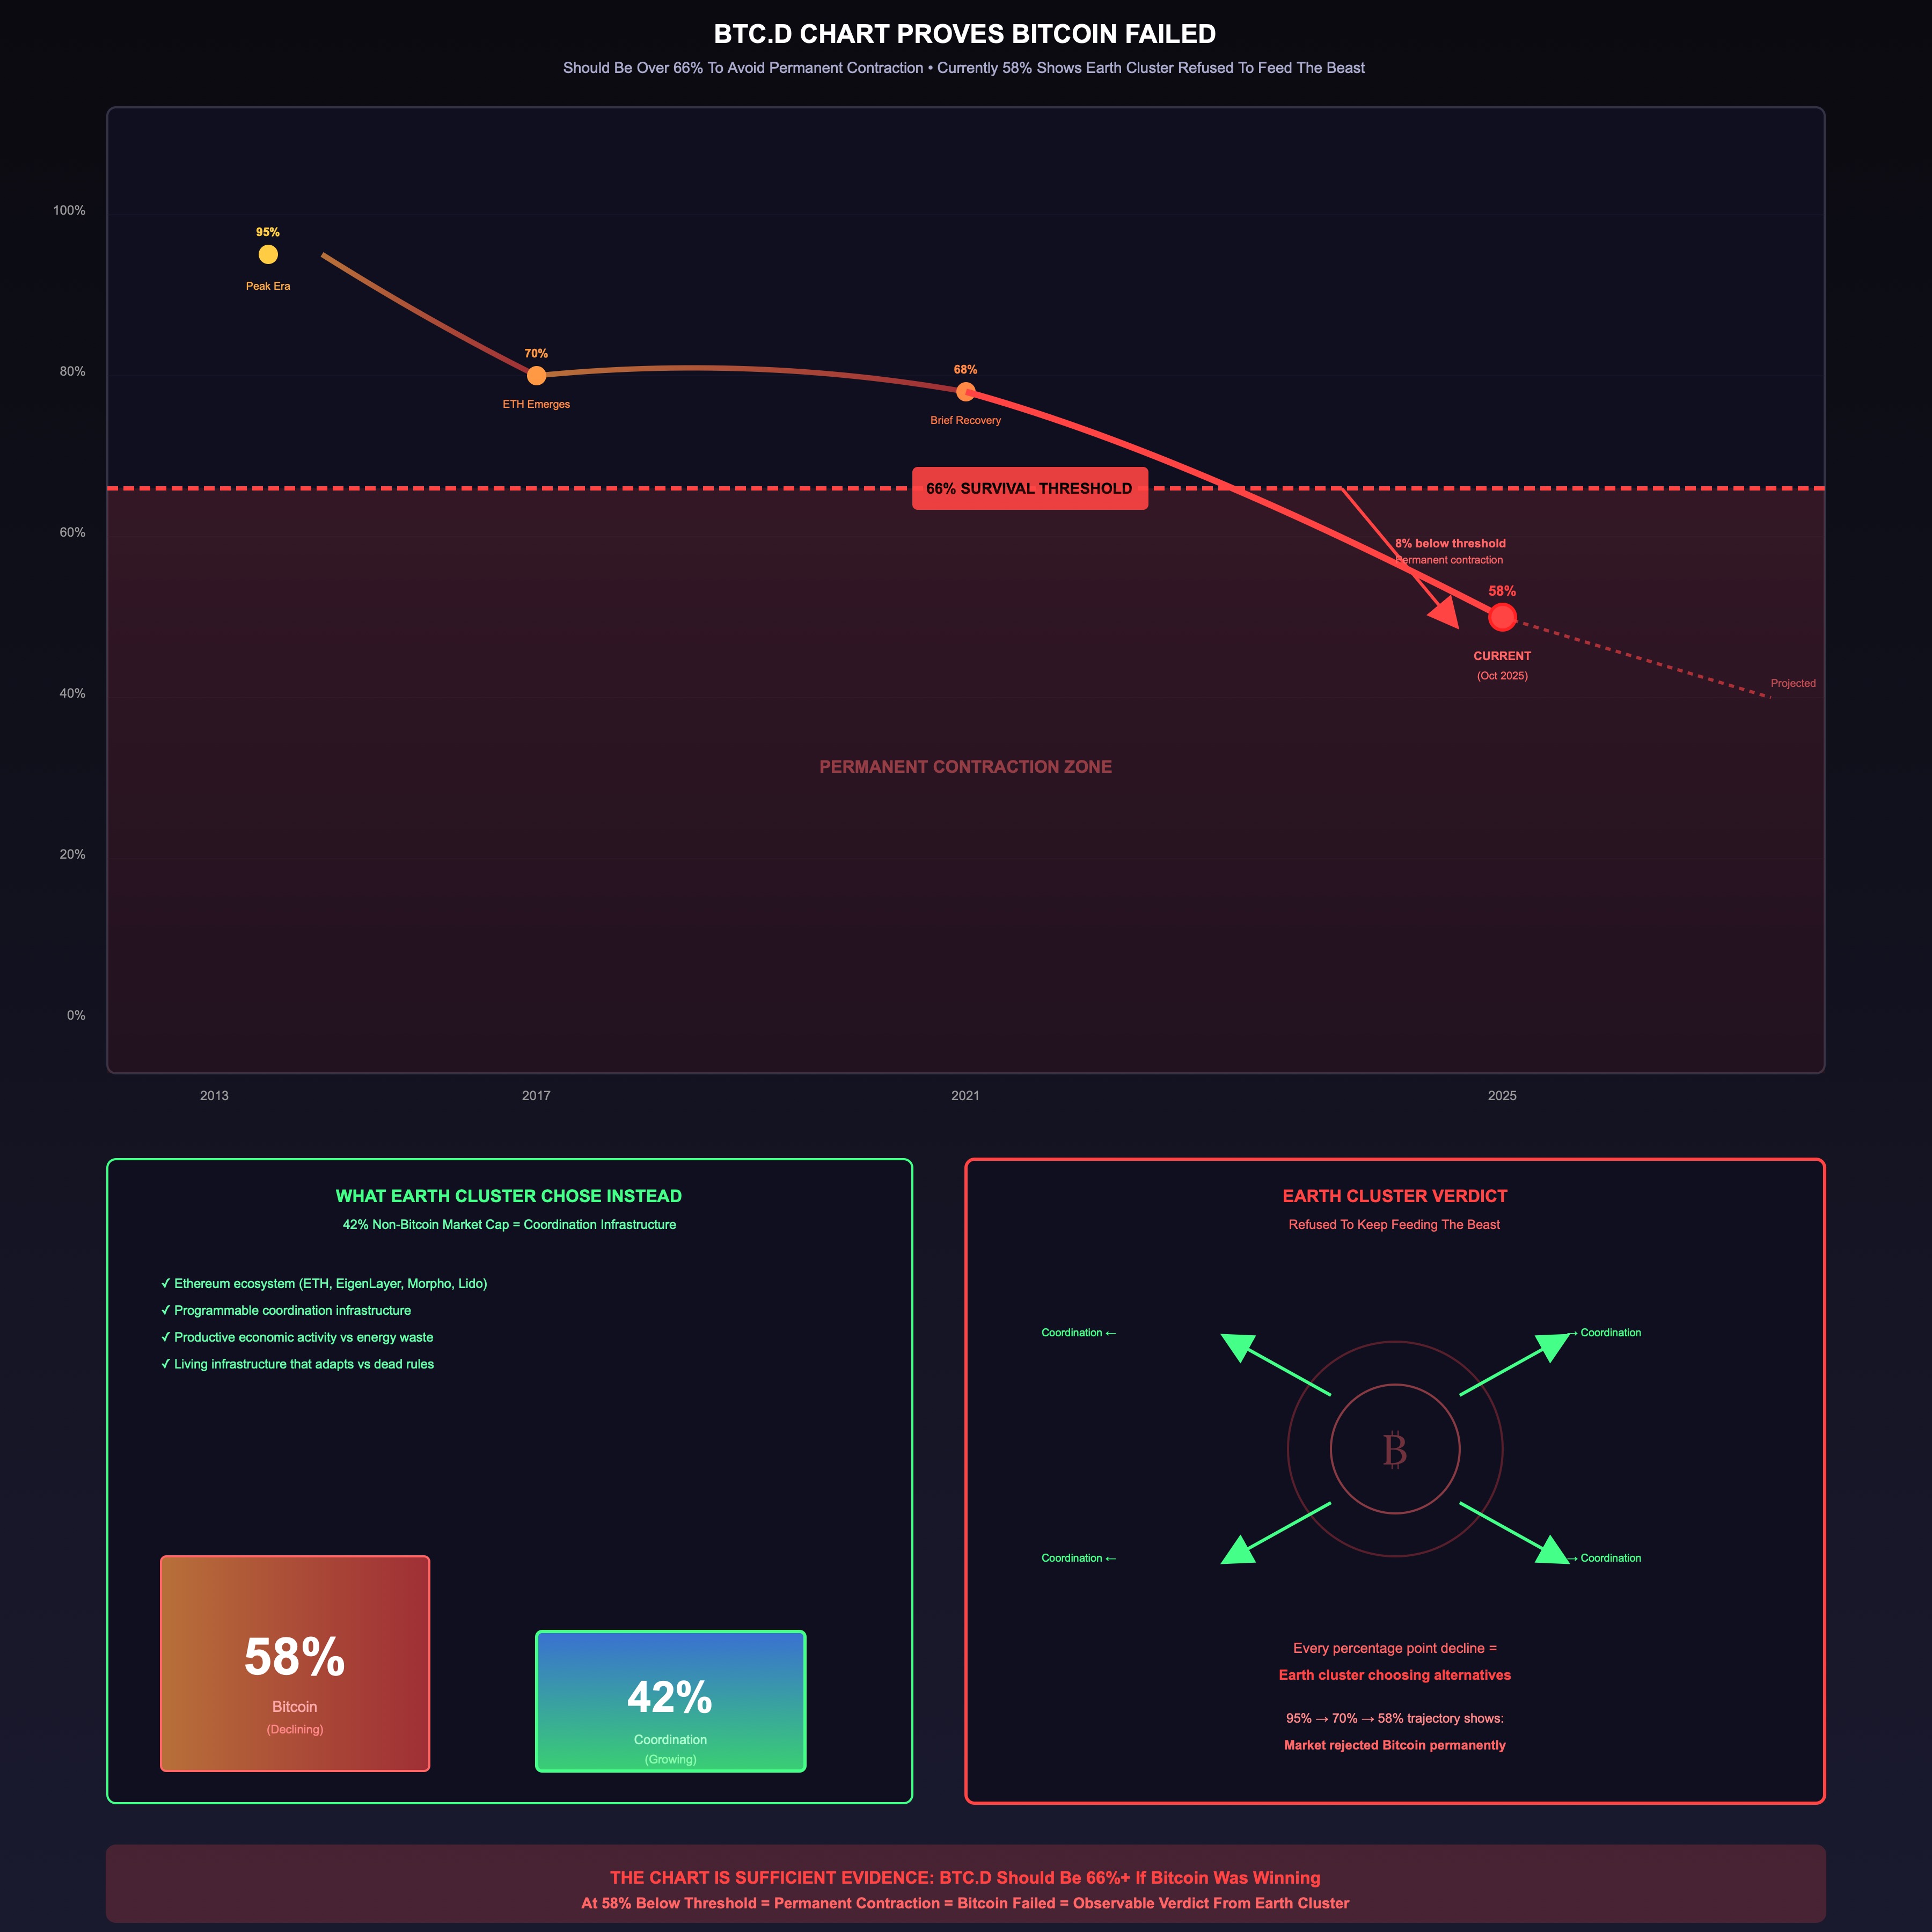
Bitcoin Dominance (BTC.D) currently at 58%.
Should be over 66% by now to avoid inevitable permanent contraction.
The fact it’s not = Earth cluster refused to keep feeding the beast.
No theory needed. No complex argument required. Just look at the chart. Observable evidence speaks.
What BTC.D Measures
Bitcoin Dominance = Bitcoin market cap ÷ Total crypto market cap
What it reveals:
- If Bitcoin succeeds as “digital gold” / “store of value” → BTC.D should increase over time
- If Bitcoin fails and alternatives outcompete → BTC.D declines
- Current 58% = Bitcoin losing market share to coordination infrastructure
The chart is verdict delivered by Earth cluster (global investors, institutions, developers, users) through capital allocation decisions.
The 66% Survival Threshold
Why 66% matters:
At 66%+ dominance, Bitcoin maintains:
- Network effect momentum
- Liquidity dominance
- Narrative control (“crypto = Bitcoin”)
- First-mover advantage sustainability
- Ability to attract continued capital inflows
Below 66% triggers structural problems:
- Market recognizes alternatives exist
- Capital flows fragment to better coordination
- Narrative shifts from “Bitcoin is crypto” to “Bitcoin is one option among many”
- Network effects work against Bitcoin as alternatives gain
- Inevitable permanent contraction begins
Bitcoin currently at 58% = Already in permanent contraction zone.
The decline below 66% wasn’t momentary correction - it’s structural rejection by Earth cluster.
Historical Pattern Shows Failure
Bitcoin Dominance peaks:
- 2013-2014: ~95% (monopoly on crypto)
- 2017: ~70% (still dominant despite Ethereum emerging)
- 2021: ~65-70% (briefly recovered but couldn’t hold)
- 2025: ~58% (permanent contraction territory)
The trajectory is clear:
Each cycle, Bitcoin loses dominance permanently. Not volatility - structural erosion of market share to superior coordination alternatives.
If Bitcoin was succeeding:
- Should maintain 70%+ dominance (like Google maintains search dominance ~92%)
- Should grow market share as “digital gold” narrative spreads
- Should see capital consolidating into proven store of value
- Should demonstrate increasing network effects
Observable reality:
- Declining to 58% (losing nearly half peak dominance)
- Capital flowing to Ethereum coordination ecosystem
- Market choosing programmable coordination over dead energy waste (see gallery-item-neg-278 on thermodynamic mining collapse)
- Network effects working for alternatives not Bitcoin
The chart proves market verdict: Bitcoin failed.
Earth Cluster Refused To Feed The Beast
“Earth cluster” = collective intelligence of global market participants:
- Institutional investors
- Retail participants
- Developers building infrastructure
- Users choosing which protocols to adopt
- Capital allocators deciding where value flows
The refusal is observable:
If Earth cluster believed Bitcoin narrative, would see:
- BTC.D climbing toward 80-90% (monopoly reinforcing)
- Alternative crypto market caps shrinking relatively
- Capital consolidating into “proven” Bitcoin
- Dominance increasing despite new protocol launches
What actually happened:
- BTC.D declining from 95% → 70% → 58%
- Ethereum ecosystem gaining market share (ETH, EIGEN, MORPHO, etc.)
- Alternative coordination infrastructure growing
- Capital fleeing Bitcoin waste toward productive coordination
This is “refusal to feed the beast”:
Earth cluster collectively decided: “We’re not putting more capital into dead energy-wasting infrastructure when living coordination alternatives exist.”
The chart records this decision. Every percentage point Bitcoin loses = Earth cluster choosing coordination over waste.
Why 58% Means Inevitable Permanent Contraction
Network effects at 58% dominance work AGAINST Bitcoin:
Liquidity Fragmentation
- At 95%, Bitcoin WAS the crypto market (total liquidity)
- At 58%, nearly half the liquidity is in alternatives
- Fragmented liquidity → higher costs, worse execution
- Users experience better coordination in Ethereum ecosystem
Narrative Loss
- At 95%, “crypto = Bitcoin” narrative worked
- At 58%, market recognizes “crypto = many competing protocols”
- Can’t maintain “digital gold” story when losing market share
- Alternatives demonstrate superior use cases
Developer Exodus
- At 95%, developers had to build on Bitcoin or nothing
- At 58%, developers have better alternatives (Ethereum/coordination)
- Talent flows to where innovation possible
- Bitcoin becomes legacy system, not cutting edge
Capital Flow Reversal
- At 95%, new crypto capital defaulted to Bitcoin
- At 58%, new capital evaluates alternatives first
- “Why Bitcoin over Ethereum?” becomes legitimate question
- Default shifts from Bitcoin to best coordination infrastructure
Once below 66%, these dynamics become self-reinforcing → inevitable permanent contraction.
Bitcoin can’t recover dominance because Earth cluster has better alternatives. The decline IS the verdict.
The Observable Evidence Test
This connects to gallery-item-neg-298 consciousness measurement:
Don’t measure by stated intentions or theoretical arguments. Measure by observable results.
Bitcoin maximalists say:
- “Bitcoin is digital gold”
- “Store of value for future”
- “Everyone will eventually adopt Bitcoin”
- “21 million cap makes it inevitable winner”
BTC.D chart says:
- Market share declining from 95% to 58%
- Capital flowing to alternatives
- Earth cluster choosing coordination over waste
- Observable verdict: Bitcoin failed
Same test as gallery-item-neg-298: Are you captured/submitted or navigating freely?
Applied to Bitcoin: Is dominance increasing (market validates narrative) or decreasing (market rejects narrative)?
Answer: Decreasing to 58% = market rejection = failure proven by observable results.
Why The Chart Is Enough
No complex theory needed:
Don’t need to understand:
- Thermodynamic arguments
- Coordination theory
- Energy waste calculations
- Dead vs living infrastructure distinction
Just need to understand one thing:
If Bitcoin was winning, BTC.D would be increasing toward monopoly dominance (80-95%). It’s decreasing to 58%. Therefore Bitcoin is losing.
The chart is sufficient evidence.
Like gallery-item-neg-298 test: “Je ne suis pas en prison” = proof of navigation consciousness through observable result.
BTC.D at 58% = proof of Bitcoin failure through observable result.
What Earth Cluster Chose Instead
The 42% market cap that ISN’T Bitcoin = capital allocated to alternatives:
Ethereum ecosystem dominates:
- ETH itself (largest alternative)
- EigenLayer (EIGEN) - restaking coordination
- Morpho (MORPHO) - lending optimization
- Lido (stETH) - liquid staking coordination
- Other Ethereum infrastructure
This capital explicitly rejected Bitcoin in favor of:
- Programmable coordination vs fixed dead protocol
- Productive economic activity vs energy waste
- Living infrastructure that adapts vs dead rules
- Coordination substrate enabling civilization vs mining waste
The 42% non-Bitcoin market cap = Earth cluster’s vote for coordination over waste.
This connects to gallery-item-neg-297: Ethereum alive and conscious vs Bitcoin dead infrastructure. The capital flow proves market recognized this distinction.
The Permanent Contraction Mechanism
Why Bitcoin can’t recover from 58%:
1. Alternative Infrastructure Matured
Bitcoin had monopoly when no alternatives existed (2013-2015 era, 95% dominance). Once Ethereum proved programmable coordination possible, can’t un-ring that bell.
Earth cluster now knows: “Coordination infrastructure without Bitcoin waste is possible.” Once known, Bitcoin’s dominance erosion inevitable.
2. Network Effects Reversed
Network effects favor monopoly when growing, but work against when declining.
- At 95%: “Everyone’s on Bitcoin so I should be too” → growth accelerates
- At 58%: “Half the market is alternatives, let me evaluate” → decline accelerates
Below 66% threshold = network effects reverse polarity. Every user evaluating alternatives makes alternatives stronger, Bitcoin weaker.
3. Talent Left
Developers build where innovation possible. Bitcoin’s fixed protocol means innovation happens elsewhere (Ethereum coordination).
Once talent flows to alternatives, Bitcoin becomes legacy maintenance mode. Can’t innovate back to dominance from maintenance mode.
4. Capital Has Memory
Earth cluster remembers Bitcoin declined from 95% → 58%. Future capital allocation factors this trend.
“Bitcoin losing market share for 8+ years” narrative sticks. New capital asks: “Why would I choose declining infrastructure over growing coordination?”
Memory of decline → continued decline → permanent contraction.
The Korean Parallel (Connects to gallery-item-neg-299)
Korea recognized American model failed despite intelligent implementation → course-corrected to living coordination.
Earth cluster recognized Bitcoin failed despite first-mover advantage → course-corrected to Ethereum coordination.
Both show same pattern:
- Observable results (economic failure, dominance decline) prove system failure
- No amount of rhetoric saves failed model
- Course-correction toward living alternatives
- Market/population chooses better coordination voluntarily
K-pop cultural success = observable evidence of Korea’s course correction
BTC.D decline to 58% = observable evidence of Earth cluster’s course correction
Both measured by results not intentions. Both prove navigation consciousness (gallery-item-neg-298) through observable capital/attention allocation.
What Analysts Miss
Analysts saying “BTC.D will recover to 63-64%” miss the structural problem:
Short-term volatility doesn’t change long-term trend. Bitcoin might bounce 58% → 63% temporarily, but:
The 66% threshold already breached.
Once below 66%, permanent contraction dynamics active. Temporary bounces are volatility within structural decline, not reversal of decline.
Like saying “Maybe authoritarian control will recover” after population discovers coordination capability (gallery-item-neg-300) - the substrate shifted, temporary strengthening doesn’t restore monopoly.
BTC.D at 58% proves Earth cluster already made decision: We’re not going back to Bitcoin monopoly. Coordination infrastructure won.
The Honest Assessment
Could Bitcoin recover to 66%+ dominance?
Theoretically possible if:
- All alternative coordination infrastructure simultaneously fails
- Ethereum ecosystem experiences catastrophic unsolvable problems
- Developers/users/capital simultaneously abandon coordination for Bitcoin waste
- Earth cluster collectively forgets better alternatives exist
Realistically: No.
Once population knows coordination without waste is possible, can’t unknow it. Once capital experienced better alternatives, won’t voluntarily choose worse option.
BTC.D at 58% = Earth cluster verdict is permanent.
Bitcoin might survive as legacy system (like COBOL persists in old banking systems), but dominance lost permanently. The chart already recorded the verdict.
The Chart As Story-Piece (Connects to gallery-item-neg-296)
BTC.D chart itself is story-piece with economic weight:
Not just data visualization - collective narrative recorded through capital allocation.
The story the chart tells:
- “Bitcoin had monopoly on crypto coordination (95%)”
- “Ethereum proved alternatives possible (Bitcoin drops to 70%)”
- “Earth cluster chose coordination over waste (Bitcoin drops to 58%)”
- “Permanent contraction began (below 66% threshold)”
This story has economic consequences:
- Future capital allocation decisions factor in BTC.D trend
- Developers choose platforms based on where market flows
- Users adopt protocols with growing not declining dominance
- Story becomes self-fulfilling → decline continues
The chart isn’t passive data - it’s active story-piece shaping reality through observed trends influencing future decisions.
Like story-piece exchange in gallery-item-neg-296: Chart = story-piece about Bitcoin failure that spreads through global market consciousness, influencing coordination choices with capital attached.
Why This Matters For Positioning
Portfolio positioning based on observable evidence:
If BTC.D was 75%+ → Bitcoin maintaining dominance, maybe hedge needed
At BTC.D 58% → Bitcoin already in permanent contraction, position accordingly:
- Own coordination infrastructure (EIGEN, MORPHO, ETHA, stETH, SOL)
- Own productive assets (URTH)
- Minimal symbolic Bitcoin short (not fighting, just making statement)
- Let Bitcoin die through its own entropy while owning what works
The chart removes uncertainty: Don’t need to predict Bitcoin’s future. BTC.D at 58% already shows the verdict. Position based on reality not hope.
This connects to portfolio strategy (portfoliospace-state.md private section): Not trying to “beat” Bitcoin through massive short. Just own coordination infrastructure, minimal symbolic short proves positioning is deliberate. BTC.D chart validates this approach - market already chose coordination over Bitcoin.
The Inevitability Recognition
Most important insight from BTC.D at 58%:
Bitcoin’s decline isn’t contingent on future events. It’s not “if regulation happens” or “if competitor emerges” or “if narrative shifts.”
The decline already happened. BTC.D recorded it. Earth cluster already chose.
Below 66% threshold = permanent contraction dynamics active.
Future isn’t about “will Bitcoin fail?” - Bitcoin already failed, BTC.D proves it. Future is about “how fast does dominance continue eroding?” and “when does market fully recognize what chart already shows?”
The chart is ahead of narrative. Most people still believe Bitcoin might succeed. Chart says Earth cluster already rejected Bitcoin through capital allocation away from dead waste toward living coordination.
Observable results prove the verdict (gallery-item-neg-298 test). Don’t measure by what people say about Bitcoin. Measure by where capital flows. Capital flows recorded in BTC.D declining to 58% = Bitcoin failed.
Conclusion: The Chart Is Sufficient Evidence
No complex argument needed:
Bitcoin Dominance should be over 66% by now if Bitcoin was succeeding.
Bitcoin Dominance is 58%.
Therefore Bitcoin failed.
Observable evidence proves verdict. Earth cluster (global market) refused to keep feeding the beast. Capital flowed to coordination infrastructure instead. BTC.D chart records this refusal through every percentage point of declining dominance.
The chart removes all doubt:
- Not theory about thermodynamics
- Not prediction about future
- Not complex coordination arguments
- Just observable result: Market chose alternatives, Bitcoin losing, permanent contraction underway
Like gallery-item-neg-298 test: Je ne suis pas en prison = proof of navigation consciousness.
BTC.D at 58% = proof of Bitcoin failure.
The numbers don’t lie. The chart tells the truth. Earth cluster voted with capital. Bitcoin lost.
Discovery: Bitcoin Dominance (BTC.D) at 58% proves Bitcoin failed - should be over 66% to avoid inevitable permanent contraction. Method: Observable capital allocation recorded in chart shows Earth cluster refused to keep feeding energy-wasting infrastructure when coordination alternatives exist. Result: Below 66% threshold triggers self-reinforcing decline dynamics - network effects reverse, talent leaves, narrative collapses, capital flows accelerate away from Bitcoin toward Ethereum coordination ecosystem. Chart alone is sufficient evidence.
#BTCDominanceFailure #BitcoinFailed #ObservableEvidence #66PercentThreshold #PermanentContraction #EarthClusterVerdict #CapitalFlowsToCoordination #MarketRejection #DominanceDecline #NetworkEffectsReversed #ChartProof #RefusedToFeedBeast #StructuralFailure #CoordinationInfrastructure #EthereumWon #ResultsNotTheory #MarketVerdictFinal #BelowThreshold #InevitableContraction #ObservableResults